
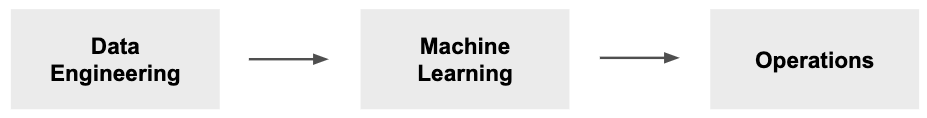
As discussed in one of our previous Tech Tuesdays on Deployment, a successful data science project generally comprises twelve essential steps. And these twelve steps can be roughly divided into three stages. Here’s the one diagram I come back to time after time that offers an overview of these three stages. It’s so simple:
And here’s how much time we spend on each section:
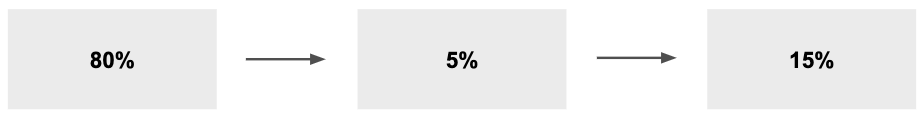
As you can see, the great majority of time is spent on data engineering. A significant 80%! It is important to point this out as the value of data engineering is often underestimated. And that’s exactly what I’m going to address in today’s Tech Tuesday. We’ll look at how a typical project might go and deconstruct the huge data engineering time sink.
The Value of Data Engineering
Machine learning is easy. If it weren’t, companies like Amazon and Google wouldn’t be so successful at automating it. That’s why the Machine Learning stage generally accounts for only 5% of time spent on a data science project. It’s simply not that difficult anymore.
Deployment (making machine learning insights available to a wide audience) is very similar, although not at all trivial. If we’re going to deploy (make use of) some fancy predictive algorithm, we need to feed it good data. Trash in, trash out, definitely applies here. And this is where the value of data engineering comes in.
Here, data engineering is the process of making the data usable for analytics processes. There’s a lot of cleaning and organizing that goes into the deployed machine learning model. Siri doesn’t just turn your lights on by magic! It took a lot of data engineers a lot of time to clean and organize data to train it to understand the human voice. “A lot of time” is an understatement.
So, if you want to streamline your data science projects, focus on data and hire appropriately, because the other parts are not nearly as difficult, expensive, or time-intensive.
Trifacta, a company that tries to make the data cleaning process easier, has this to say:
80% of the time spent on data analytics is allocated to data munging, where IT manually cleans the data to pass over to business users who perform analytics. Data munging is time-consuming and disjointed process gets in the way of extracting true value and potential from data.
That’s right, it definitely does get in the way.
But it’s not as straightforward as passing your messy data into a black box and out pops perfectly clean usable data. This is because each new dataset is different from the last. Customer interaction data will have different cleaning needs than customer profile data purchased from a third party, or analytics data gathered from a Google API.
This is especially true as more and more companies need to go beyond internal datasets for data enrichment. Data enrichment can be a differentiator as companies look to deeper user profiles for powerful profile or segment detection. But it comes at a cost: integration with your current data stack. How would you handle 3,000 more user attributes for each of your users? What if the data you purchase has inconsistencies? The answer is, it’s complicated and very time-consuming.
There’s no end to the snafus we see in datasets. From the simple zip code issue where zip codes are stored as integers (there are not integers!) to columns containing single values in some fields and large JSON objects in others! We’ve seen so many different versions of “dirty” data and each requires its own approach to handle, often requiring the involvement of stakeholders to help us clean it all up.
The take-away: Plan on spending 80%+ on getting your data into a workable format for effective data science. It’s a pain, sure, but when it’s done right, the big gains of deployment are only a short sprint away.
Of Interest
Remote Work is Changing how Productivity is Measured
The moment entire companies moved their workforces remote, business owners and employees alike both started to realize new realities about their jobs. For years, people had been told, “It’s essential for you to be in the office,” only to suddenly realize that being in the office wasn’t so essential after all. Companies all over the world have come to realize that working from home is not only more efficient but more suitable for the wants and needs of today’s workers. Life after COVID-19 for businesses will never be the same. Here are the two big changes we can expect to see moving forward.
5 Reasons to Switch From Jupyter Notebook to Scripts
Most online data science courses use Jupyter Notebook as a medium to teach. This makes sense because it is easier for beginners to start writing code in Jupyter Notebook’s cells than writing a script with classes and functions. Moreover, it makes it easy to explore and plot data. When we type ‘Shift + Enter’, we’ll immediately see the results of the code, making it easy for us to identify whether our code works or not. There are, however, several fallbacks of Jupyter Notebook. Here are 5 Reasons to switch from Jupyter Notebook to Scripts.
How to Choose a Data Analytics Platform
Whether you have responsibilities in software development, devops, systems, clouds, test automation, site reliability, leading scrum teams, infosec, or other information technology areas, you’ll have increasing opportunities and requirements to work with data, analytics, and machine learning. Here’s a brief guide to the analytics lifecycle, the expanding array of tools and technologies, and selecting the right data platform for your needs.